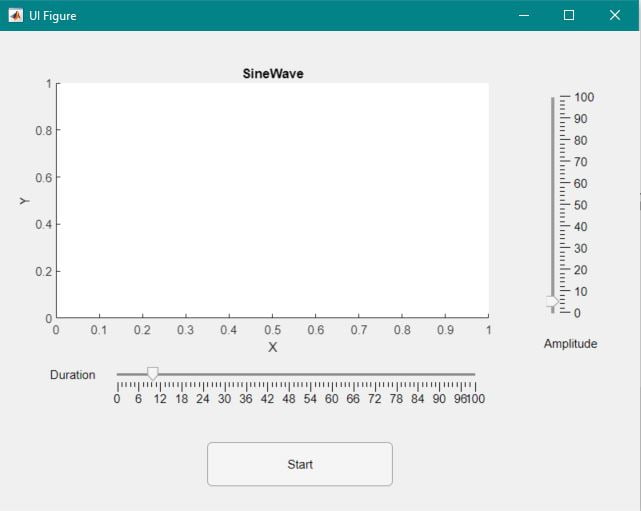
This page shows steps to create an App Designer GUI. Further, it shows how we can use the App Designer to set parameters of Simulink model through workspace variable method (using assignin command).
It further shows the API to simulate the model for a fixed duration setting the duration using the StopTime argument. And at last it shows the steps to plot the output in the UIAxes using the simout from the sim command.
The source code:
classdef AppDesigner_SL_Model < matlab.apps.AppBase
% Properties that correspond to app components
properties (Access = public)
UIFigure matlab.ui.Figure
UIAxes matlab.ui.control.UIAxes
StartButton matlab.ui.control.Button
DurationSliderLabel matlab.ui.control.Label
DurationSlider matlab.ui.control.Slider
AmplitudeSliderLabel matlab.ui.control.Label
AmplitudeSlider matlab.ui.control.Slider
end% Callbacks that handle component events
methods (Access = private)% Button pushed function: StartButton
function StartButtonPushed(app, event)
assignin(‘base’,’Ampl’,app.AmplitudeSlider.Value);
simout = sim(‘SineWave_SL’, ‘StopTime’, num2str(app.DurationSlider.Value));
plot(app.UIAxes, simout.SineWaveValue.Time, simout.SineWaveValue.Data);end
end% Component initialization
methods (Access = private)% Create UIFigure and components
function createComponents(app)% Create UIFigure and hide until all components are created
app.UIFigure = uifigure(‘Visible’, ‘off’);
app.UIFigure.Position = [100 100 640 480];
app.UIFigure.Name = ‘UI Figure’;% Create UIAxes
app.UIAxes = uiaxes(app.UIFigure);
title(app.UIAxes, ‘SineWave’)
xlabel(app.UIAxes, ‘X’)
ylabel(app.UIAxes, ‘Y’)
app.UIAxes.Position = [17 158 481 292];% Create StartButton
app.StartButton = uibutton(app.UIFigure, ‘push’);
app.StartButton.ButtonPushedFcn = createCallbackFcn(app, @StartButtonPushed, true);
app.StartButton.Position = [208 26 186 44];
app.StartButton.Text = ‘Start’;% Create DurationSliderLabel
app.DurationSliderLabel = uilabel(app.UIFigure);
app.DurationSliderLabel.HorizontalAlignment = ‘right’;
app.DurationSliderLabel.Position = [46 127 51 22];
app.DurationSliderLabel.Text = ‘Duration’;% Create DurationSlider
app.DurationSlider = uislider(app.UIFigure);
app.DurationSlider.Position = [118 136 358 3];
app.DurationSlider.Value = 10;% Create AmplitudeSliderLabel
app.AmplitudeSliderLabel = uilabel(app.UIFigure);
app.AmplitudeSliderLabel.HorizontalAlignment = ‘right’;
app.AmplitudeSliderLabel.Position = [540 158 59 22];
app.AmplitudeSliderLabel.Text = ‘Amplitude’;% Create AmplitudeSlider
app.AmplitudeSlider = uislider(app.UIFigure);
app.AmplitudeSlider.Orientation = ‘vertical’;
app.AmplitudeSlider.Position = [552 199 3 216];
app.AmplitudeSlider.Value = 5;% Show the figure after all components are created
app.UIFigure.Visible = ‘on’;
end
end% App creation and deletion
methods (Access = public)% Construct app
function app = AppDesigner_SL_Model% Create UIFigure and components
createComponents(app)% Register the app with App Designer
registerApp(app, app.UIFigure)if nargout == 0
clear app
end
end% Code that executes before app deletion
function delete(app)% Delete UIFigure when app is deleted
delete(app.UIFigure)
end
end
end
Snapshot of the design of the App:

Corresponding Simulink model:

YouTube Posts and Comments
Question:
Is there a command that actually lets one see the change in the plot instantly as soon as he changes the value in the slide bar, so as to make it more real and interactiveAnswer:
It is possible to design the GUI such that the changes are reflected instantly in the plot. For this one simply has to add callback function (value change callback) to the slide bar. And in this call back function rewrite the plot command for the axes. This will refresh the plot immediately for any value change of the slide bar.


What is ‘StopTIme’ in the example. It gives me the error ‘block_diagram does not have a parameter named xxx when i try to change it
Kindly watch the video between 5:30 to 6:20. It explains about the Stop Time argument.
The Stop Time in the code is:
StopTime = num2str(app.DurationSlider.Value)
Cheers
Programmer World
–
how can I display the out in gauge
Below page should help. Please refer:
https://programmerworld.co/matlab/plot-in-uiaxes-and-demo-of-slider-knob-and-gauge-in-app-designer-in-matlab/
Cheers
Programmer World
–
How to create simulink model by designing and coding in app designer and guide.Please make video on it