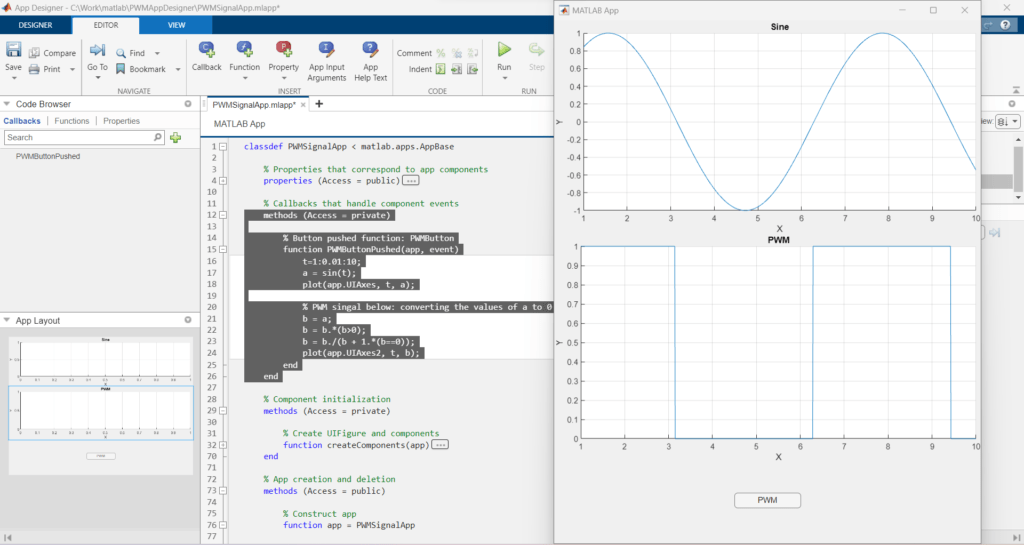
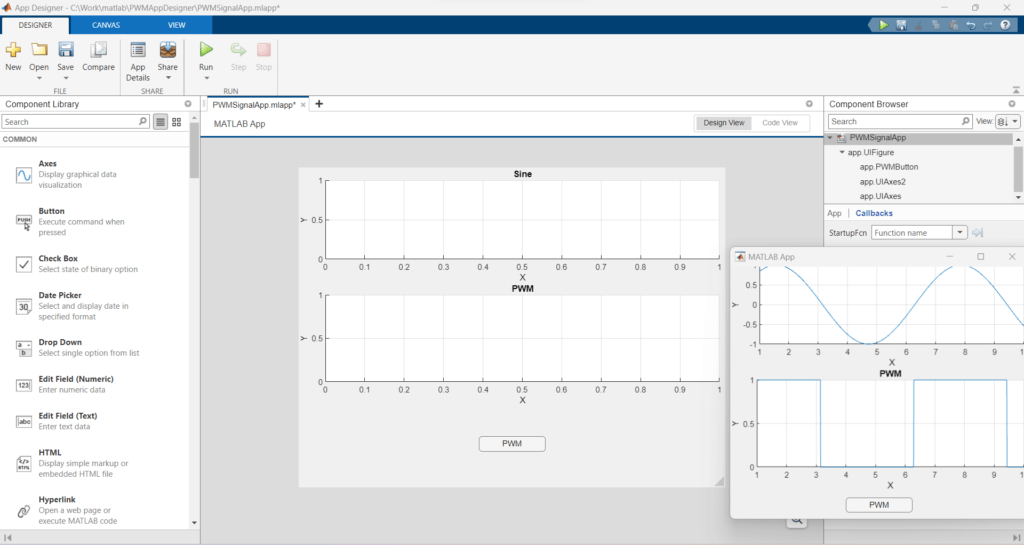
This video shows the code to generate and plot PWM signal in UI Axes of the UI designed in the MATLAB App Designer.
I hope you like this video. For any questions, suggestions or appreciation please contact us at: https://programmerworld.co/contact/ or email at: programmerworld1990@gmail.com
Complete source code and other details:
Main method:
    methods (Access = private)


        % Button pushed function: PWMButton

        function PWMButtonPushed(app, event)

            t=1:0.01:10;

            a = sin(t);

            plot(app.UIAxes, t, a);


            % PWM singal below: converting the values of a to 0 and 1

            b = a;

            b = b.*(b>0);

            b = b./(b + 1.*(b==0));

            plot(app.UIAxes2, t, b);

        end

    end
Complete Class:
classdef PWMSignalApp < matlab.apps.AppBase


    % Properties that correspond to app components

    properties (Access = public)

        UIFigure   matlab.ui.Figure

        PWMButton  matlab.ui.control.Button

        UIAxes2    matlab.ui.control.UIAxes

        UIAxes     matlab.ui.control.UIAxes

    end


    % Callbacks that handle component events

    methods (Access = private)


        % Button pushed function: PWMButton

        function PWMButtonPushed(app, event)

            t=1:0.01:10;

            a = sin(t);

            plot(app.UIAxes, t, a);


            % PWM singal below: converting the values of a to 0 and 1

            b = a;

            b = b.*(b>0);

            b = b./(b + 1.*(b==0));

            plot(app.UIAxes2, t, b);

        end

    end


    % Component initialization

    methods (Access = private)


        % Create UIFigure and components

        function createComponents(app)


            % Create UIFigure and hide until all components are created

            app.UIFigure = uifigure('Visible', 'off');

            app.UIFigure.Position = [100 100 640 480];

            app.UIFigure.Name = 'MATLAB App';


            % Create UIAxes

            app.UIAxes = uiaxes(app.UIFigure);

            title(app.UIAxes, 'Sine')

            xlabel(app.UIAxes, 'X')

            ylabel(app.UIAxes, 'Y')

            zlabel(app.UIAxes, 'Z')

            app.UIAxes.XGrid = 'on';

            app.UIAxes.YGrid = 'on';

            app.UIAxes.ZGrid = 'on';

            app.UIAxes.Position = [1 308 640 173];


            % Create UIAxes2

            app.UIAxes2 = uiaxes(app.UIFigure);

            title(app.UIAxes2, 'PWM')

            xlabel(app.UIAxes2, 'X')

            ylabel(app.UIAxes2, 'Y')

            zlabel(app.UIAxes2, 'Z')

            app.UIAxes2.XGrid = 'on';

            app.UIAxes2.YGrid = 'on';

            app.UIAxes2.ZGrid = 'on';

            app.UIAxes2.Position = [1 124 640 185];


            % Create PWMButton

            app.PWMButton = uibutton(app.UIFigure, 'push');

            app.PWMButton.ButtonPushedFcn = createCallbackFcn(app, @PWMButtonPushed, true);

            app.PWMButton.Position = [271 55 100 23];

            app.PWMButton.Text = 'PWM';


            % Show the figure after all components are created

            app.UIFigure.Visible = 'on';

        end

    end


    % App creation and deletion

    methods (Access = public)


        % Construct app

        function app = PWMSignalApp


            % Create UIFigure and components

            createComponents(app)


            % Register the app with App Designer

            registerApp(app, app.UIFigure)


            if nargout == 0

                clear app

            end

        end


        % Code that executes before app deletion

        function delete(app)


            % Delete UIFigure when app is deleted

            delete(app.UIFigure)

        end

    end

end
Screenshots:


Excerpt:
The provided content is about a video that demonstrates how to generate and plot a Pulse Width Modulation (PWM) signal in MATLAB App Designer’s UI Axes. The source code for the task is shared. It involves creating a class called PWMSignalApp with app components like UIAxes and PWMButton. After creating UIFigure and components, a function named PWMButtonPushed is declared. This function generates a sine wave and a PWM signal corresponding to it, plotting both signals on different UI Axes. The user is encouraged to direct any questions, suggestions, or appreciations to the provided contact email address.

