Know all about Android Development, Selenium Testing, MATLAB/ Simulink Modeling and much more …
Draw Concentric Circles Plot in Simulink Scope
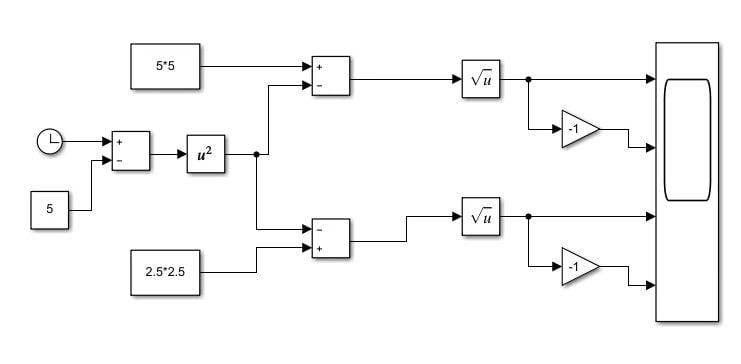
This video shows how circles can be drawn in simulink scope. It shows how circle mathematical equation can be converted into a Simulink model by using just simple blocks provided by MathWorks.
[Model Images]
Top post or comments from YouTube
Thank you so much, it helps a lot. Is there any probability to change the X-axis of simulink scope to other signal other than time with out calling to workspace? I want to plot three outputs on the same figure but one of them is power versus voltage. I have to count the intersection time of power versus voltage plot so using ‘to workspace’ have not help since the plot in work space is plotted after the simulink simulation finished.
No, I do not think there is any way to change the X-axis of Simulink scope. Simulink scope is designed to always plot a time based system. So, X-axis will always show time.
You can export/ log the data to workspace and then use some matlab script to do all the computation you intend.
However, if the above is not helping then the only other option, probably, you have is to use some Simulink block (like comparator or switch block) within your model to count the intersection points. You can also embed small piece of matlab scripts (if needed) using matlab function block in the model. Sorry, I can’t think of any better solution as of now.
Good Luck!
We will be glad to hear from you regarding any query, suggestions or appreciations at: programmerworld1990@gmail.com